

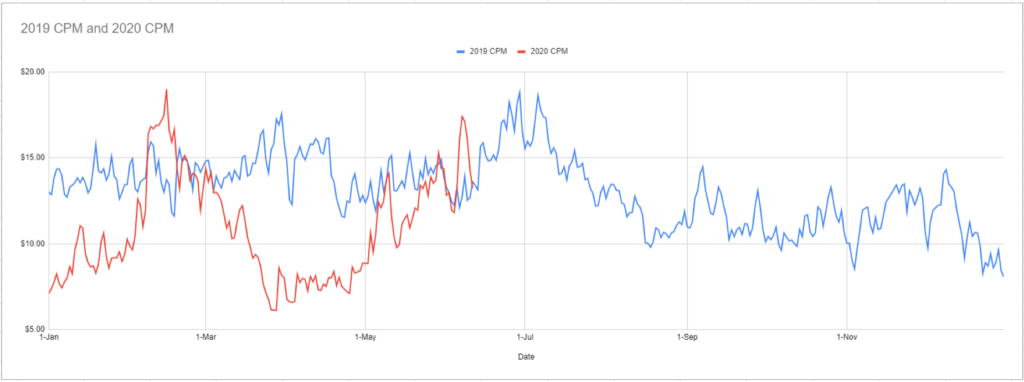
Back in March, when the effects of COVID-19 were just beginning to impact the global mobile app advertising market, Consumer Acquisition was one of the first companies to call out that CPMs were rapidly dropping on mobile ad networks like Facebook, Google, Admob, Chartboost, Unity and others. Back then, the company recommended that advertisers front load their Q2 spend as we didn’t know how long low CPMs would last.
Now, Consumer Acquisition is calling the ceiling — inexpensive social advertising is over, CPMs have dramatically increased over the course of May and June. The markets have normalized or are very close to it. Here’s what is important to know about these events and what advertisers should be doing now to maximize ROAS.
COVID-19 Impact to Mobile App Ad Spend in March and April
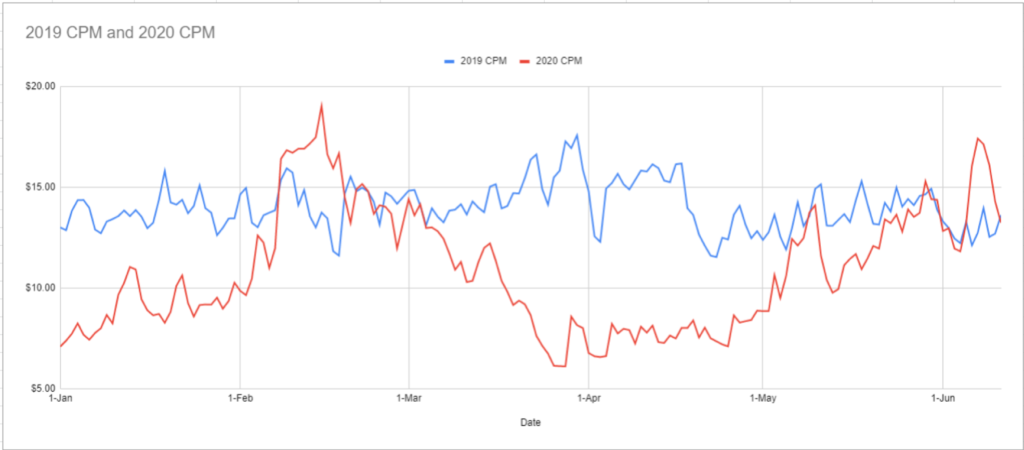
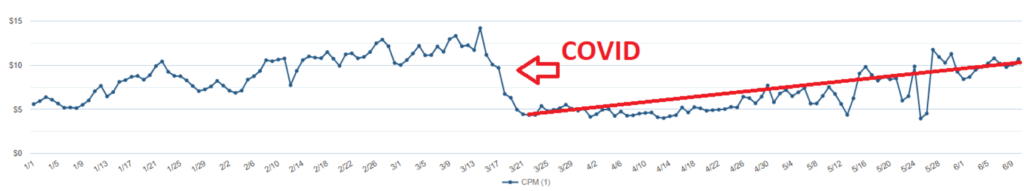
As seen through the data, COVID-19 and mandatory stay-at-home orders that began mid-March caused a +250% decrease in CPMs, as businesses impacted by the global crises pulled back spending, particularly in SMB, travel, restaurants, auto, B&M retail and luxury. This also created a media buying opportunity on Facebook, Google and other mobile ad networks for businesses that supported people who stayed home, such as with gaming, e-commerce, streaming, entertainment, financial, logistics and delivery.
When required to shelter-in-place, people sought distractions with Netflix, YouTube TV, Hulu and of course, they played games and spent on entertainment. Additionally, delivery apps such as for grocery shopping and food delivery rose during this period.
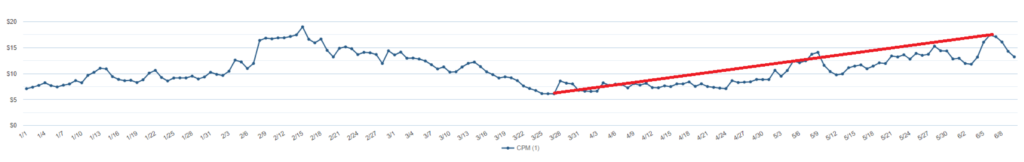
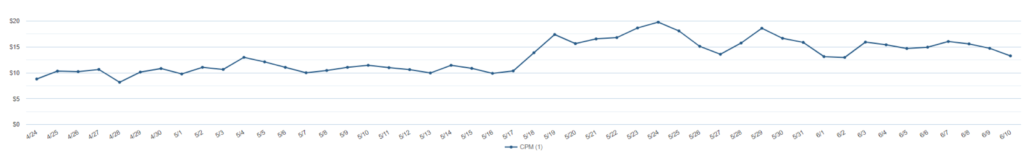
As regions have begun to open back up for services and travel, the market is recovering and CPMs are dramatically increasing. For instance with the client data just below, CPMs rose from $5 to $10 over the course of May 2020, over a 100% increase.
Particularly among apps that monetize with purchases, cost-per-installs (CPIs) increase with CPMs vs apps that monetize with ads, and their monetization increases with the rise in CPMs.

So What’s Next?
Based on data trends, it appears back to business as usual for mobile app advertisers. This means that the Artificial Intelligence (AI) behind the leading ad platforms algorithms will continue automating key elements of media buying to maximize profit. Since the algorithms optimizing media buying have gotten better, it’s leveled the playing field for advertisers big and small so that they can all operate with increased efficiency.
But, there’s one area that AI can’t automate yet, and that’s creative. As such, now, creative is the key differentiator that is driving UA.
With the return to normalcy of CPMs, it’s time to get back to the hard work of optimizing creative. And, while quality and volume of creative are key factors in success, they’re not the only factors that drive profitable UA. Monitoring creative trends and doing in-depth competitive analysis are a must within any UA or creative team today.
Creative trends change quicker than fashion and vary across genres. While it’s good to know broad creative trends, advertisers will want to hone in on their particular niche and overlay all this with actual performance data.
To get you started, Consumer Acquisition offers seven genre-specific creative trend reports, which can be found here: https://www.consumeracquisition.com/creative-is-king/
About Consumer Acquisition
Founded in 2013, Consumer Acquisition provides a creative studio, fully-managed user acquisition and SaaS tools for social advertisers. The company has managed over $3 billion in creative and social ad spend for the world’s largest mobile games and apps including Rovio, Glu Mobile, Roblox, Jam City, Wooga, Lion Studios, Sun Basket and many others. For more information, visit www.consumeracquisition.com.
Facebook® is a registered trademark of Facebook Inc.
Google® is a registered trademark of Google LLC.


 With SaneBox. Sign up today and save $25 on any subscription.")